Abstract
This paper aims to investigate the numerical simulation of breathing for nanoparticle deposition of the human lung. The solid particles in the air that are passing through the human respiratory channels (considered as the 18th generation bronchial tube, which is narrow in diameter and short in length) have an impact on how our lungs exchange gases. In this study, a mathematical model within this respiratory tube of the human lung is taken into consideration. The unsteady Navier- Stokes equation is used to represent the fluid particles, and the equation of continuity is used to represent the nanoparticles. The governing equation is simulated numerically using the finite difference techniques under some assumption of axial symmetry and laminar flow, effectively reducing the problem into two dimensions. Results for velocity variation of air and dust particles have been discovered in this discussion. Effects of parameters like Reynolds number and pulse frequency have also been found. Additionally, results demonstrated that the axial velocity of fluid and particles increases with an increase in Reynolds number and frequency along both the length and diameter of the tube. Later, a comparison between fluid and particles for the velocity profile has been discussed.
Keywords
Human Lung, Nanoparticle Deposition, Mathematical Modelling, 18th – Generation Tube, Finite Difference Method
1. Introduction
The fluid dynamics of the breathing air and its constituent particles are a part of respiratory physiology and lung architecture
| [1] | A. Saini et al, "Two-dimensional model of nanoparticle deposition in the alveolar ducts of the human lung," Application of Applied Mathematics, vol. 12, pp. 305-318, 2017. |
[1]
. The function of breathing, specifically taking in (inspiration) oxygen from the air and releasing (expiration) carbon dioxide into the atmosphere, is known as respiration
| [2] | A. Guyton, In: Dreibelbis D (ed) Textbook of medical physiology, Saunders, Philadelphia, 1986. |
[2]
. The complex airway is strongly correlated with the movement and deposition of particles. To analyze the conducting zone, the airways from the mother generation (G0) to 16 generations are employed, whereas the gas exchange occurs in the airways from 17 to 23 generations. To protect the lower airway, the upper respiratory system, which runs from the nasal cavity to the trachea, serves as both a channel and a filter, while some microscopic pollutants may still manage to pass through and harm the body. Every day each person inhales billions of particles along with the surrounding air. Airborne particles, particularly nanoparticles, may be harmful to human health. Particle sizes of nanoparticles are typically less than 100 nm, according to their definition
| [3] | A. Maynard, "Nanotechnology: the next big thing, or much ado about nothing?," Ann. Occup. Hyg., vol. 51, pp. 1-12, 2007. |
[3]
. Nanoparticles are very toxic not only depending on their biochemical composition but also on the size and location of the deposition
| [4] | H. Qiao et al, "The transport and deposition in the respiratory system by inhalation," J. Nanomaterials, pp. 1-8, 2015. |
[4]
. These particles are subdivided in terms of their dimensions
| [5] | J. Tiwari et al, "Zero-dimensional, one dimensional, two-dimensional and three-dimensional nanostructured materials for advanced electrochemical energy devices," Progress in Materials Science, vol. 57, pp. 724-803, 2012. |
[5]
, and named nanodots, nanowires, nanotubes, quantum crystals
| [6] | R. Aitken et al, Nanoparticle: An Occupational Hygiene Review., Institute of Occupational Medicine for the Health and Safety Executive, 2004, pp. 1-102. |
[6]
etc. The respiratory system is more vulnerable to nanoparticle exposure since airborne nanoparticles enter the human body through inhalation
| [7] | M. Brauer et al, "Air pollution and retained particles in the lung," Environmental Health Perspectives, vol. 109, pp. 1039-1043, 2001. |
[7]
. The lung is an essential respiratory organ that is responsible for gas exchange. The most vital part of the human lung is the alveolar region, which contains millions of alveoli and was created expressly to allow effective gas diffusion during the normal breathing process
| [8] | A. Jung et al., "The number of alveoli in the human lung," American Journal of Respiratory and Critical Care Medicine, vol. 169, pp. 120-124, 2004. |
[8]
. There are three factors (namely, physical, physiological, and morphological) that have a significant impact on aerosol deposition in human respiratory airways
| [9] | K. Cheng et al, "In vivo: measurements of nasal airway dimensions and ultrafine aerosol deposition in the human nasal and oral airways," J. Aerosol Science, vol. 27, pp. 785-801, 1996. |
[9]
.
According to estimates, burning solid, biomass, and fossil fuels produced many airborne particulates
| [10] | Y. Cheng et al, "The characteristics of beijing aerosol during two distinct episodes: impacts of biomass burning and fireworks," Environmental Pollution, vol. 185, pp. 149-157, 2014. |
[10]
. Epidemiological research discovered that air pollution has a negative impact on health, especially if it is a nanoscale pollutant
| [11] | D. Tang et al, "Air pollution effects on fetal and child development: a cohort comparison in China Environmental Pollution," vol. 185, pp. 90-96, 2014. |
[11]
. Thus, airborne contaminants that depend on nanoparticles and ultrafine particles are given the most attention today.
| [9] | K. Cheng et al, "In vivo: measurements of nasal airway dimensions and ultrafine aerosol deposition in the human nasal and oral airways," J. Aerosol Science, vol. 27, pp. 785-801, 1996. |
| [12] | K. Cheng et al., "Calculation of total deposition fraction of ultrafine aerosols in human extra thoracic and intrathoracic regions," Aerosol Science and Technology, vol. 22, pp. 194-201, 1995. |
| [13] | S. Smith et al., "Deposition of ultrafine particles in human tracheobronchial airways of adults and children," Aerosol Science and Technology, vol. 35, pp. 697-709, 2001. |
[9, 12, 13]
described their measurement for mass transfer and deposition of nanoparticles
. Their laboratory study on nanoparticle deposition was introduced by M. Lippmann et al.
| [14] | M. Lippmann et al., "Ultrafine particle deposition in a human tracheo-bronchial cast," Aerosol Science and Technology, vol. 32, pp. 1082-1091, 1990. |
[14]
. The effectiveness of nasally depositing nanoparticles
was described
| [15] | B. Asgharian et al., "Particlr deposition in human nasal airways replicas manufactured by different methods. Part II: Ultrafine particles," Aerosol Science and Technology, vol. 38, pp. 1072-1079, 2004. |
[15]
. The local deposition fractions of nanoparticles (
nm) of healthy adults in alveoli were developed by
| [16] | J. Kim et al., "Analysis of total respiratory deposition of inhaled ultrafine particles in adult subjects as various breathing patterns," Aerosol Science and Technology, vol. 38, pp. 525-540, 2004. |
[16]
. According to a theoretical study by
| [17] | K. Rogers, The Respiratory System, New York: Britannica Educational Publishing, 2011. |
[17]
, nanoparticles are grouped together with highly erratic shapes because of their extremely small size, and after inhalation, these particles are absorbed by the lungs and are retained there for a longer time by epithelial cells, where they promote the growth of cancerous cells. The most important factors of these types of dust particles in different generations (G0-G23) of the lung include the shape and size of particles, tidal volume of the lung, and inhaling frequency
| [18] | B. Agharian et al., "Effect of fiber geometry on deposition in small air-ways of the lung," Aerososlc Iencean D Technology, vol. 4, pp. 59- 474, 1998. |
[18]
. Saini et al.
| [1] | A. Saini et al, "Two-dimensional model of nanoparticle deposition in the alveolar ducts of the human lung," Application of Applied Mathematics, vol. 12, pp. 305-318, 2017. |
[1]
studied the deposition of nanoparticles
and obtained that the alveolar ducts of the human lung eventually receive these particles after they have traveled further into the lung. Saini et al.
| [19] | Pratibha et al., "Numerical simulation of gas flow through a biofilter in lung tissues.," World Journal of Modelling and Simulation, vol. 11, p. 33–42, 2015. |
[19]
considered the alveolar region as a biofilter and found that the lung is effective in removing nanoparticles from the environment.
Based on the review it is discovered that there are numerous theoretical and experimental research that state the effects of nanoparticles on the respiratory system. These researchers presupposed various generations of lungs in their analysis. Thus, it is aimed to study the numerical simulation of breathing for nanoparticle deposition through the 18th generation. For this purpose, this paper considered a mathematical model introduced by Saini et al. that has been developed to quantitatively characterize the movement and deposition of nanoparticles that allows the investigation in a lung area where direct experimental data collection is insufficient. To analyze the impact of breathing particles on the lung, it is assumed the governing equation as the momentum equation. These equations are illustrated numerically by the finite difference approach, which assumes axial symmetry under some conditions so that the problem effectively turns two-dimensional. The results of velocity curves for the air and dust particles have been demonstrated. The impact of different flow parameters (Reynolds number, pulse frequency) has been investigated. A comparison between fluid and dust particles has been discussed.
2. Mathematical Model
2.1. Physical Interpretation
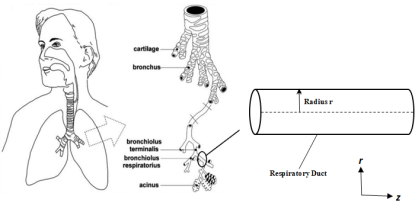
To recognize the flow pattern, the study is assumed the respiratory duct of 18
th generation bronchiole tube with radius
, where
and
represent the axial and radial direction of flow, as drawn in
Figure 1.
Figure 1. Cross sectional view of respiratory bronchiole tube.
2.2. Governing Equations
A two-dimensional unsteady laminar Newtonian flow with a pressure gradient that changes with time is taken into consideration. Since the change of density of the fluid (air) might be negligible, the fluid is considered as an incompressible and viscous. The motion of dusty air is along with axially of tube and there is no flow in radially. Under these assumptions, a two-dimensional mathematical model put forth by Saini et al.
| [1] | A. Saini et al, "Two-dimensional model of nanoparticle deposition in the alveolar ducts of the human lung," Application of Applied Mathematics, vol. 12, pp. 305-318, 2017. |
[1]
is considered to find out the effect of breathing particles.
The corresponding two-dimensional momentum equation together with the continuity are given below:
Equation of mass
Equation of axial momentum
(3)
(4)
Equation of radial momentum
(5)
(6)
where, and represent the velocity components of the air in axial and radial direction respectively, and be velocity components of the dust particles in axial and radial direction respectively, is the fluid pressure, is the fluid density, being the coefficient of kinematic viscosity, is the number density, is the mass of the dust particle, is the Stokes resistance coefficient. Consider the Stokes resistance,
where,
is the dynamic viscosity of the fluid and,
is the radius of the particles. Since the wall radius
is approximately small for the pressure wave, equations (
5) and (
6) simply turn to
and therefore it may be neglected. Additionally, this study hypothesized a time-dependent pressure gradient,
which is appeared in equation (
3) as follows:
where, is the fixed pressure gradient amplitude, is the size of the pulsatile component,
is the frequency of the dust particle.
2.3. Boundary Conditions
It is presumed that there exists no flow when .
The velocity gradient of the air in axial direction may implicitly be equal to zero because no radial flow takes place along the axial direction of the fluid and particles.
,,,
At the wall surface,
3. Methodology
3.1. Transformation of the Governing Equations
To illustrate above equations from (
1) to (
4) numerically, construct the dimensionless form by using some non-dimensional quantities as follows:
Now after transformation, equations (
1) to (
4) along with the boundary conditions become:
(8)
(10)
3.2. Transformation of the Boundary Conditions
at
at
at
4. Numerical Simulation
Since the present governing equations are nonlinear, it is quite challenging and time-consuming to determine the nonlinear equations analytically. As a result, it is executed numerically to find the required results of the given model. The finite difference technique is used to solve the present problem as it is simple and easy to calculate. The grid generation is defined in the manner shown below:
where, are the spatial and temporal indices, and represent the length for spatial variables and is the length for temporal variable respectively. The approximate solution at grid points for axial velocity of fluid and particles are written as and respectively.
Now, the model equations are discretized using FTCSCS and FTFSFS schemes.
The 1st order forward time difference formula
(11)
The 1st order forward space difference formula in radial direction
(12)
The 1st order forward space difference formula in axial direction
(13)
The 2nd order central space difference formula in radial direction
(14)
The 2nd order central space difference formula in axial direction
(15)
are used to execute the following computational scheme.
Substituting equations (
11) to (
15) into (
8) and rearranging the time level that implies
which, is the required discretization equation for axial velocity of fluid particles at
Again, after discretization the axial velocity of dust particles (10) at becomes,
Also inserting equations (
11), (
12), (
13) into
(7) and (
9) respectively, the discretized velocity of fluid and dust particles in radial direction at
give
The stability condition for the schemes is shown in
Table 1Table 1. Stability Conditions.
Schemes | Stability |
FTFSFS | Unconditionally Stable |
FTCSCS | |
The discretized form of initial and boundary conditions, imply to
,,,
,,,
,,,
5. Result and Discussion
Assume that the oxygen temperature at the 18th generation bronchial tube is about C. However, the 18th generation tube is very short in length, nearly about 1.2 mm and very narrow in diameter, closely about 0.5 mm and its Reynolds number is 0.2. At, the densityof air is and dynamic viscosityof air is. In the given model, massof the dust particleis, radiusof the dust particles is, lumen radius, , number density (that is, total number of particles per unit volume) is , constant amplitude,, amplitude of the pulsatile component, and is the pulse frequency.
To compute numerically, the whole domain is divided by nodes for axis andnodes for axis and 2000 nodes for time.
Effect of velocity profile for different time periods
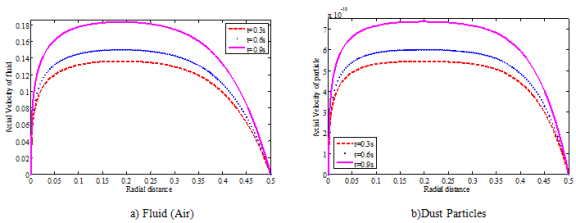
Axial velocity profiles of fluid and dust particles along radial distance (diameter) for various time is respectively shown in the following
figures 2(a) and 2(b).
Figure 2. Axial velocity profile of fluid and particles for various period along radial distance.
Figure 2 demonstrates that the axial flow profile of fluid and particles explains similar shapes at different time scales. Here at time
(which is marked by a solid magenta color curve), get the maximum axial velocity and at
(indicated by the dashed red color curve), attain the minimum axial velocity, and at
(indicated by the dotted blue color curve), velocity lies in between the maximum and minimum value for both the fluid and particles, respectively. As the pressure gradient term is time-dependent function. From Boyle’s law, we know that at a constant temperature pressure and volume are inversely related. Consequently, air travels downward from a high-pressure region to a low-pressure region.
Thus, this study concludes that as time grows from to, the axial velocity increases gradually.
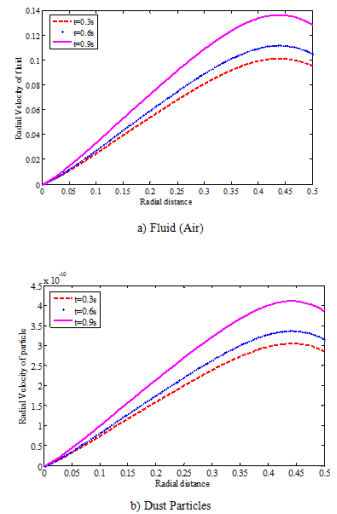
Radial velocity profiles along radial distance (diameter) for different time is respectively shown in the following
figure 3(a) and 3(b).
Figure 3. Radial velocity profile of fluid and particles for various period along radial distance.
The radial velocity component of air and dust varies radially during various time periods, as seen in
figures 3(a) and 3(b). As one moves away from it, it is discovered that the value on the axis increases from zero with positive values. On the surface of the wall, it eventually approaches a certain finite value.
Therefore, one can say that as time increases from to, the radial velocity of fluid and particles increases.
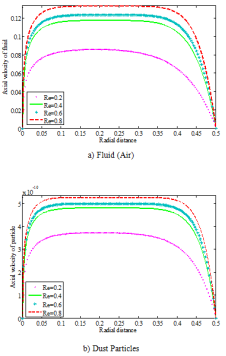
5.1. Effects of Reynold Number
The effects of Reynolds number for the velocity in axial and radial directions of fluid and particles along the diameter of the circular tube are depicted in
figures 4 and 5 respectively.
Figure 4. Effect of Reynolds number for velocity in axial direction of fluid and particles along the diameter of the tube.
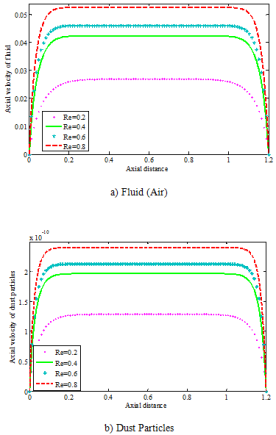
Figure 5. Effect of Reynolds number for velocity in axial direction of fluid and particles along the tube.
According to
figures 4 and 5, it is found that after increasing the Reynolds number from 0.2 to 0.8, velocity of fluid (air) and particles in axial direction increases gradually along the diameter and length of the tube respectively.
Since low Reynolds numbers result in high concentration on the walls of airways, large Reynolds numbers result in a low concentration on those walls, which encourages total gas transmission.
Therefore, fluid viscosity decreased at high Reynolds number Re=0.8 compared to Re=0.2 and, hence the fluid flow increases for both air and particles.
5.2. Effect of Frequency
The effect of frequency for velocity in axial direction of fluid and particles along the diameter of the tube are found in
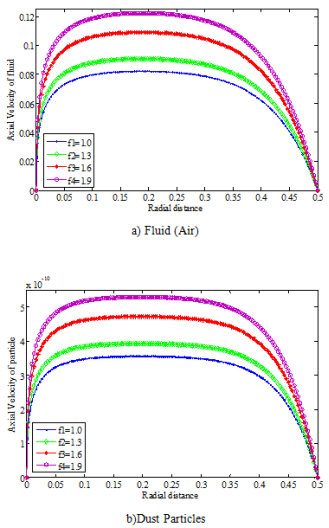
figures 6 and 7 respectively.
Figure 6. Effects of frequency on axial velocity of fluid and particles along the diameter of the tube.
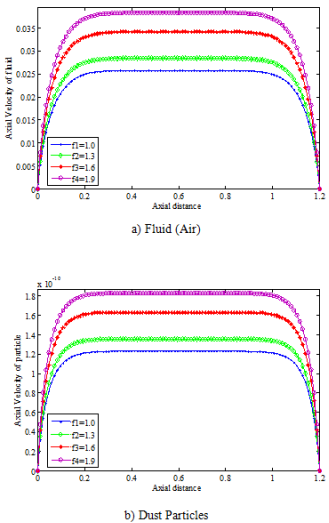
According to
figures 6 and 7, it is found that velocity profiles at
for fluid and particles in both directions respectively, which gives parabolic velocity profiles, and these figures increase by increasing
gradually. These profiles attain maximum velocity at
.
Figure 7. Effects of frequency on the axial velocity direction of fluid and particles along the tube.
6. Conclusion
In the present investigation, a 2D model defining the nanoparticles of diameter 50 nm, of air through a circular tube of airway duct is considered. It is solved the governing equations numerically to show the effects of flow variation of fluid and particles. The main conclusions of the current analysis are listed below:
1. It is obtained that the axial and radial velocity of fluid and particles increased for various time along radial distance.
2. In this discussion, the overall axial velocity of fluid and particles is significantly increased by increasing the Reynolds number along both the axial and radial distance.
3. The figures show that the changes in fluid and particle velocities are caused by the various frequencies of respiration.
4. It is obvious that velocity and density are inversely related. Now by comparing all the figures, it conclude that the overall velocity variations of a fluid exceed the overall velocity of particles along the radial distance. Therefore, fluid particles enter faster than dust particles.
In the current analysis, the study discussed flow in the radial direction only, but it can be expanded in axial direction too. Wall shear stress plays a significant role during inspiration and expiration. One can show the effects of wall shear stress for various amplitudes. Since the present study is restricted to nanoparticles, the size of the particle sample should be increased to produce meaningful results for the particle trajectory and local deposition fractions. Although the current discussion is limited to two-dimensional flow, it can be expanded into higher dimensional as well to analyze the problem more realistically. Additionally, the current model is adaptable to simultaneous modifications.
Author’s Contribution
Roni Akter: Investigation, Conceptualization, Methodology, Formal analysis, Figure Sketching, Writing - original draft, review & editing. Nilufar Yasmin: Design of the study, Conceptualization, Participated in the sequence alignment, Writing – review & editing. Mahtab U Ahmed: Supervision, Writing– review & editing, Validation.
Data Availability
Data will be made available on request.
Acknowledgements
N.Y. acknowledges the financial support from the National Science and Technology (NST) Fellowship for her thesis work.
Conflicts of Interest
The authors declare no conflicts of interest.
References
| [1] |
A. Saini et al, "Two-dimensional model of nanoparticle deposition in the alveolar ducts of the human lung," Application of Applied Mathematics, vol. 12, pp. 305-318, 2017.
|
| [2] |
A. Guyton, In: Dreibelbis D (ed) Textbook of medical physiology, Saunders, Philadelphia, 1986.
|
| [3] |
A. Maynard, "Nanotechnology: the next big thing, or much ado about nothing?," Ann. Occup. Hyg., vol. 51, pp. 1-12, 2007.
|
| [4] |
H. Qiao et al, "The transport and deposition in the respiratory system by inhalation," J. Nanomaterials, pp. 1-8, 2015.
|
| [5] |
J. Tiwari et al, "Zero-dimensional, one dimensional, two-dimensional and three-dimensional nanostructured materials for advanced electrochemical energy devices," Progress in Materials Science, vol. 57, pp. 724-803, 2012.
|
| [6] |
R. Aitken et al, Nanoparticle: An Occupational Hygiene Review., Institute of Occupational Medicine for the Health and Safety Executive, 2004, pp. 1-102.
|
| [7] |
M. Brauer et al, "Air pollution and retained particles in the lung," Environmental Health Perspectives, vol. 109, pp. 1039-1043, 2001.
|
| [8] |
A. Jung et al., "The number of alveoli in the human lung," American Journal of Respiratory and Critical Care Medicine, vol. 169, pp. 120-124, 2004.
|
| [9] |
K. Cheng et al, "In vivo: measurements of nasal airway dimensions and ultrafine aerosol deposition in the human nasal and oral airways," J. Aerosol Science, vol. 27, pp. 785-801, 1996.
|
| [10] |
Y. Cheng et al, "The characteristics of beijing aerosol during two distinct episodes: impacts of biomass burning and fireworks," Environmental Pollution, vol. 185, pp. 149-157, 2014.
|
| [11] |
D. Tang et al, "Air pollution effects on fetal and child development: a cohort comparison in China Environmental Pollution," vol. 185, pp. 90-96, 2014.
|
| [12] |
K. Cheng et al., "Calculation of total deposition fraction of ultrafine aerosols in human extra thoracic and intrathoracic regions," Aerosol Science and Technology, vol. 22, pp. 194-201, 1995.
|
| [13] |
S. Smith et al., "Deposition of ultrafine particles in human tracheobronchial airways of adults and children," Aerosol Science and Technology, vol. 35, pp. 697-709, 2001.
|
| [14] |
M. Lippmann et al., "Ultrafine particle deposition in a human tracheo-bronchial cast," Aerosol Science and Technology, vol. 32, pp. 1082-1091, 1990.
|
| [15] |
B. Asgharian et al., "Particlr deposition in human nasal airways replicas manufactured by different methods. Part II: Ultrafine particles," Aerosol Science and Technology, vol. 38, pp. 1072-1079, 2004.
|
| [16] |
J. Kim et al., "Analysis of total respiratory deposition of inhaled ultrafine particles in adult subjects as various breathing patterns," Aerosol Science and Technology, vol. 38, pp. 525-540, 2004.
|
| [17] |
K. Rogers, The Respiratory System, New York: Britannica Educational Publishing, 2011.
|
| [18] |
B. Agharian et al., "Effect of fiber geometry on deposition in small air-ways of the lung," Aerososlc Iencean D Technology, vol. 4, pp. 59- 474, 1998.
|
| [19] |
Pratibha et al., "Numerical simulation of gas flow through a biofilter in lung tissues.," World Journal of Modelling and Simulation, vol. 11, p. 33–42, 2015.
|
Cite This Article
-
-
@article{10.11648/j.ajam.20241205.14,
  author = {Roni Akter and Nilufar Yasmin and Mahtab Uddin Ahmmed},
  title = {Numerical Simulation of Gas Flow and Nanoparticle Deposition in the Human Lung
},
  journal = {American Journal of Applied Mathematics},
  volume = {12},
  number = {5},
  pages = {141-148},
  doi = {10.11648/j.ajam.20241205.14},
  url = {https://doi.org/10.11648/j.ajam.20241205.14},
  eprint = {https://article.sciencepublishinggroup.com/pdf/10.11648.j.ajam.20241205.14},
  abstract = {This paper aims to investigate the numerical simulation of breathing for nanoparticle deposition of the human lung. The solid particles in the air that are passing through the human respiratory channels (considered as the 18th generation bronchial tube, which is narrow in diameter and short in length) have an impact on how our lungs exchange gases. In this study, a mathematical model within this respiratory tube of the human lung is taken into consideration. The unsteady Navier- Stokes equation is used to represent the fluid particles, and the equation of continuity is used to represent the nanoparticles. The governing equation is simulated numerically using the finite difference techniques under some assumption of axial symmetry and laminar flow, effectively reducing the problem into two dimensions. Results for velocity variation of air and dust particles have been discovered in this discussion. Effects of parameters like Reynolds number and pulse frequency have also been found. Additionally, results demonstrated that the axial velocity of fluid and particles increases with an increase in Reynolds number and frequency along both the length and diameter of the tube. Later, a comparison between fluid and particles for the velocity profile has been discussed.
},
 year = {2024}
}
 Copy
|
Copy
|
 Download
-
TY  - JOUR
T1  - Numerical Simulation of Gas Flow and Nanoparticle Deposition in the Human Lung

AU  - Roni Akter
AU  - Nilufar Yasmin
AU  - Mahtab Uddin Ahmmed
Y1  - 2024/09/26
PY  - 2024
N1  - https://doi.org/10.11648/j.ajam.20241205.14
DO  - 10.11648/j.ajam.20241205.14
T2  - American Journal of Applied Mathematics
JF  - American Journal of Applied Mathematics
JO  - American Journal of Applied Mathematics
SP  - 141
EP  - 148
PB  - Science Publishing Group
SN  - 2330-006X
UR  - https://doi.org/10.11648/j.ajam.20241205.14
AB  - This paper aims to investigate the numerical simulation of breathing for nanoparticle deposition of the human lung. The solid particles in the air that are passing through the human respiratory channels (considered as the 18th generation bronchial tube, which is narrow in diameter and short in length) have an impact on how our lungs exchange gases. In this study, a mathematical model within this respiratory tube of the human lung is taken into consideration. The unsteady Navier- Stokes equation is used to represent the fluid particles, and the equation of continuity is used to represent the nanoparticles. The governing equation is simulated numerically using the finite difference techniques under some assumption of axial symmetry and laminar flow, effectively reducing the problem into two dimensions. Results for velocity variation of air and dust particles have been discovered in this discussion. Effects of parameters like Reynolds number and pulse frequency have also been found. Additionally, results demonstrated that the axial velocity of fluid and particles increases with an increase in Reynolds number and frequency along both the length and diameter of the tube. Later, a comparison between fluid and particles for the velocity profile has been discussed.

VL  - 12
IS  - 5
ER  -
Copy
|
Download