Abstract
The study of demographics is important not only for policy formulation but also for better understanding of human socio-economic characteristics, and assessment of effects of human activities on environmental impact. It is interesting to note that apart from the common population control strategies, industrialization, economic development and improvement of living standards affects population growth parameters. In this paper, an age-structured model was formulated to model population dynamics, and make predictions through simulation using 2019 Kenya population data. The age-structured mathematical model was developed, using partial differential equations on population densities as functions of age and time. The population was structured into 20 clusters each of 5 year interval, and assigned different birth, death rate and transition parameters. Crank-Nicolson numerical scheme was used to simulate the model using the 2019 parameters and population as initial conditions. It was found that; provision of social factors to an efficacy level of δ≥0.75 to a minimum of 70% population leads to a decrease of mortality rate form μold=0.0313 to μnew=0.00184 and an increase in birth rate from βold=0.02639 to βnew=0.05104. This collectively leads to an increase in population by 50% from 38,589,011 to 57,956,100 after 35 years. The initial economic dependency ratio of 1:2, was also improved due to changes in technology and improvement of living standards, to a new ratio of 1:1.14. The graphical presentation in form of a pyramid showed a trend of transition from expansive to constrictive population pyramid. This population structure is stable and remains relatively constant as long as the social factors are maintained.
Keywords
Age-Structured, Constrictive, Dependency Ratio, Expansive, Population, Simulation
1. Introduction
Population dynamics studies the changes, rates of change, causes and effects of the changes in the number and composition of organisms in an ecosystem or within confined boundaries, together with the factors that influence those changes. The pertinent parameters of change include birth rate, death rate, net migration and distribution, in terms of gender, aging and population structure
| [1] | Hugo, G., Future demographic change and its interactions with migration and climate change. Global Environmental Change, 2011. 21: p. S21-S33. |
[1]
. Mathematical modeling of population dynamics is a central topic in theoretical mathematical biology
| [2] | Brauer, F., C. Castillo-Chavez, and C. Castillo-Chavez, Mathematical models in population biology and epidemiology. Vol. 2. 2012: Springer. |
[2]
, seen as a tool used to keep track of the components of population changes and as a means to extract important parameters and determine trends from complex processes, to permit analysis of the causes of processes acting on the system and to make the prediction about the future of a given population. The continued increase in human population has posed a great challenge to the whole world, because of a rapid growth rate far outpacing the capacity of resources to support it, and consequential advancement of some technologies which impacts negatively to the environment
| [3] | Ehrlich, P. R., A. H. Ehrlich, and G. C. Daily, Food security, population and environment. Population and development review, 1993: p. 1-32. |
[3]
. This has led to uncontrolled urbanization, which has produced over-crowding, destitute settlements, crime and pollution, dismal health-care, pressure on resources and facilities, exacerbating food and water shortages reducing resilience of nature, climate change and making it harder for the most vulnerable communities to rise out of generational poverty
| [4] | Uniyal, S., et al., Human overpopulation: Impact on environment, in Megacities and Rapid Urbanization: Breakthroughs in Research and Practice. 2020, IGI Global. p. 20-30. |
[4]
.
Every government is responsible in putting realistic plans and management of its citizens in terms of provision of quality services and products. This can only be done with accurate information on its demographics which is periodically obtained through census; a time consuming, inaccurate, expensive and discrete methodology, mostly done at intervals of 10 years, giving a very long span of time that much unaccounted for changes happen. In addition, the knowledge of future population, which national census cannot project, is necessary for the purpose of planning and budgeting of citizen’s requirements and the country’s development.
In order to bridge this gap, the use of mathematical modeling provides information on current and projected population dynamics that can reliably be used for planning
| [5] | Smith, D. W., et al., Population dynamics and demography. Yellowstone wolves: science and discovery in the world's first national park, 2020: p. 77-92. |
[5]
. Mathematical demographic models help in effective provision of services to the citizens, whose success depends on the accurate data about the current and future size of the population, and its structural characteristics. Appropriate mathematical analytic and simulation methods are hereby used to draw describe the current population, and make predictions of future population size, distribution, and general structure
| [6] | Bender, E. A., An introduction to mathematical modeling. 2000: Courier Corporation. |
[6]
.
Modeling of dynamic interactions in nature provides a convenient way of understanding how numbers change over time or in relation to each other. Apart from human population, population models are also used to determine optimal harvest rate of livestock, projection in agriculture, to understand the dynamics of biological invasions, and for environmental conservation, climatic and weather forecast, epidemiology, spread of parasites, viruses, and impact of epidemics, among others
| [7] | Wilensky, U. and W. Rand, An introduction to agent-based modeling: modeling natural, social, and engineered complex systems with NetLogo. 2015: Mit Press. |
[7]
.
1.1. Population growth Factors
Factors that directly affect population growth include; Immigration and emigration, birth and death rate. Others which indirectly influence population growth rate are social factors which include; food security, economic status, literacy levels, access to health services, and affordable decent housing, occurrence of conflicts, natural calamities, among others. These factors have different impacts on the population growth rate. Some have direct and immediate effect, so that increase in provision or access of some services leads to increase in fertility, reduced mortality rate, increase in expected life span and therefore increased growth rate. Such factors include health, food, education, housing improved economic status and peaceful coexistence. However, some of these factors do not necessarily have to positively influence population increase. It is often found that, highly educated career spouses generally bring forth few children in a family, similarly the rich usually have fewer children than the poor. With this in mind, this paper assumes that naturally, once all the factors are provided equally, the synergetic effect will be uniform to all individuals, so that as much as the people are stable and therefore have fewer children, the few brought forth are heathy, have good living standards, peacefully coexist, well educated, and therefore live long and less likely to die.
As much as high population is discouraged, it has positive effects which is not limited to availability of cheap labour, increased market of products, innovation and spurred economic activities. However, high population brings negative effects like; environmental degradation, pollution, pressure on available resources, poverty, food crisis, rise of slums, increased aging dependency, dilapidated housing and health facilities, and increased insecurity. This can be avoided by determining the amount of efforts required to support and control optimal population. Many strategies of controlling population are available and they include family planning, use of contraceptives, public health education awareness campaign, use of incentives, use of policies just to mention but a few. In this research paper, analysis on the effect of social factors on population growth is analyzed.
1.2. Population Mathematical Modelling
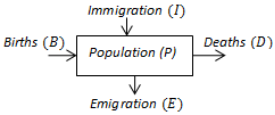
Mathematical modeling of population is based on compartmental model, where population is considered to be boxed in a compartment (
Figure 1), with inlets and outlets representing factors which either increase or decrease population as time changes.
Figure 1. Compartmental model showing changes in population compartment.
This yields a book-keeping equation to keep track of the four components of population dynamics, which yields a system of mathematical model equations that’s applied to the study of population dynamics
| [8] | White, G. C., Modeling population dynamics. Ecology and management of large mammals in North America, 2000: p. 85-107. |
[8]
. In mathematical symbolism, a discrete population model equation is expressed as;
(1)
where population size at a future time is equal to the population at time plus births minus deaths plus immigrants minus emigrants.
This is the simplest structured models where both time and the structure are discrete. The population is divided into two, the current and the future sub-populations, and the rates of growth are appended to the current population to give the next future populations. If we assume the birth rate, death rate and net migration to be denoted by and respectively, then the discrete mathematical equation is given by;
Recursive substituting for yields the close form solution,
(3)
where, is the birth rate and is the death rate and is the initial population. The population grows if the growth rate , otherwise declining.
If we assume constant growth rate and continuous population growth, the instantaneous population dynamics is modelled using ordinary differential equations as;
Here, net migration is assumed to be constant and independent of time. The solution of equation (4) by integration yields,
Notice that if by policy or any other means migration is banned, the population will grow exponentially .
Equation (
4) assumes that the population is homogeneous, that is; the children, the aged and the middle aged, all have the same characteristics in terms of birth rate, death rate, migration rate, among others. This is not true, and in order to capture the fine differences in characteristics, an age structured model is more appropriate.
1.3. Age-structured Model
Since population is always heterogeneous, it is ideal to divide the large population into homogeneous groups according to some significant parameters such as age, sex, size, maturity or proliferative state and study interactions within the given group’s population. Models of this type are called structured and they describe the time evolution of the distribution of the population according to the fixed parameters. A continuous age-structured population at a given time reveals a set of individuals who were born over a range of past time and whose fertility and probability of survival depend on their age. For instance, in the human population dynamics, the fertility and probability of survival depend on age. This area of mathematical biology has been investigated by many authors
| [9] | DILÃO, R., Mathematical models in population dynamics and ecology, in Biomathematics: modelling and simulation. 2006, World Scientific. p. 399-449. |
[9]
. Considering the population growth model depending on age, and assuming homogeinity of gender in terms of survival, birth and death rate, the population can be represented mathematically by
, which is a function of time and age. Such a model is called age-structured as explicitly described by Von-Foester and McKendrick
| [10] | Şterbeţi, C. On a model for population with age structure. in ITM Web of Conferences. 2020. EDP Sciences. |
[10]
and
| [11] | Di Cola, G., G. Gilioli, and J. Baumgärtner, Mathematical models for age-structured population dynamics: an overview. Population and Community Ecology for Insect Management and Conservation, 2020: p. 45-62. |
[11]
.
The dynamics of a continuous age – structured population is given by,
(6)
Subject to the initial and boundary conditions,
where is the population at time and age , is the specific birth rate of the population cluster at age , is age–specific death rate and is the initial age distribution while is the total population at time
It is noted that equations (
6-8) assumes homogeinity of the entire population with respect to death rate and birth rate, contrary to the reality where infants and the aged are known to be more vulnerable to death and more susceptible to diseases. As for fertility and birth rate, it is a fact that children under the age of 10 on average and adult women over 45 years are unproductive. Other age groups like school going ages (12 – 25 years) have very low birth rate, while above 35 – 45 are known to have lower fertility rate. With this in mind, an age-structured model with partitions of population into 20 clusters at intervals of 5 years is presented
| [12] | Ehrlich, P. R., Environmental disruption: Implications for the social sciences. Social Science Quarterly, 1981. 62(1): p. 7. |
[12]
. The solution is derived using Crank Nicolson numerical scheme, known to be unconditionally stable and fast converging
| [13] | Strikwerda, J. C., Finite difference schemes and partial differential equations. 2004: SIAM. |
[13]
.
2. Formulation and Analysis of Social Factors Model
This section looks at derivation of mathematical model of the factors that influences the human population dynamics. Studies shows that economic and social factors are considered as the determinants of population growth
| [14] | Lutz, W. and R. Qiang, Determinants of human population growth. Philosophical Transactions of the Royal Society of London. Series B: Biological Sciences, 2002. 357(1425): p. 1197-1210. |
[14]
. It is clear that there is a direct relationship between population and market forces like demand and supply, and in addition, investors are attracted to a market where the economy is growing
| [15] | Headey, D. D. and A. Hodge, The effect of population growth on economic growth: A meta‐regression analysis of the macroeconomic literature. Population and development review, 2009. 35(2): p. 221-248. |
[15]
. In terms of health services, epidemics like HIV/AIDS, Covid-19, and other highly contagious and fatal diseases are known to have caused significant deaths within a short time, affecting population size and structure, as the most vulnerable population (the young and the aged) are most affected
| [16] | De Meijer, C., et al., The effect of population aging on health expenditure growth: a critical review. European journal of ageing, 2013. 10: p. 353-361. |
[16]
.
In Kenya, policies have been put in place, and implementation of the strategic plan is underway to alleviate Kenya citizens from 3
rd world constraints. Among vision 2030 pillars is the social pillar which includes; Education and training, Environment, water and sanitation, Gender, youth and vulnerable groups; Health; Population, urbanization and Housing; and Sports, arts and culture
| [17] | Odhiambo, V. A., Critical success factors in the implementation of the social pillar of Kenyans vision 2030. 2014, University of Nairobi. |
[17]
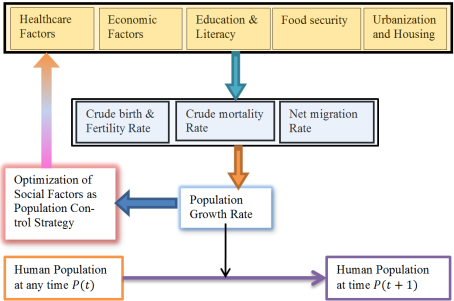
. The following flow chart shows the impact point at which social factors influence population dynamics.
Figure 2. Flow chart showing how social factors affect population parameters.
2.1. Modeling Social Factors
In order to model the effect of the social factors on population growth rate, the functional response of the population to change in the social factor , a measure of the efficacy of the social factor to change in population. Consider an exponential response function which saturates for large , defined as;
Here
denotes the proportion in percentage of efficacy of social factors implementation,
are positive constants. For small social factor satisfaction, the people seek alternative satisfaction elsewhere, reducing the effect of population, and as the social factors are improved, its effect increases to saturation, where no more effect is realized, a sigmoid function as used in predator prey defense and predation model
| [18] | González-Olivares, E., P. C. Tintinago-Ruiz, and A. Rojas-Palma, A Leslie–Gower-type predator–prey model with sigmoid functional response. International Journal of Computer Mathematics, 2015. 92(9): p. 1895-1909. |
[18]
.
The inverse function that reduces as social factors increase is defined by as;
Here,
affects the population inversely, that is, the response of mortality to population increase is inverse, so that increase in social factors, say for example health standards, reduces the mortality rate. The value of
, represents the absence of social factors and
being excellent provision of social factors,
denotes the maximum attainable value of the population parameter. In case of birth rate, the value
could mean maximum allowable birth rate as per the regulation of the region, or with reference to migration, this value
means the cap or upper limit of migration rate allowed, while in terms of mortality,
implies the minimum mortality rate allowable due to natural attrition. The constant
in equation (
9) and equation (
10) represents the efficacy of the social factor or the response rate of the population for every small change of social factors. Here, the efficacy or sensitivity of the social factors
is inversely proportional to the social factors
. Decrease in
leads to higher sensitivity of the social factor. For example, food is known to change the status of a hungry individual almost immediately as soon as the food is provided, but education takes a long time to realize the results, and thus,
where the subscript denotes education and food respectively.
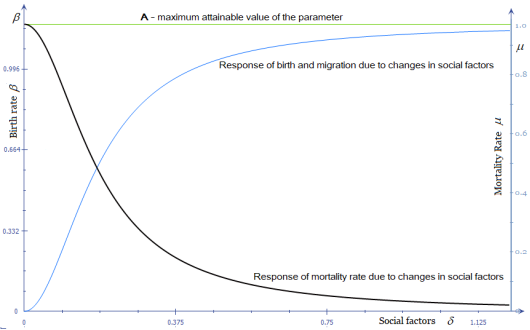
Figure 3 is a graph showing the response of population parameters to change in social factors.
Figure 3. Response function, showing the effect of social factors on birth rate and mortality rate.
From the graph in
Figure 3, it is noted that with high provision of social factors
, the birth rate and mortality rate saturates to optimal levels.
2.2. Age-Structured Model Incorporating Social Factors
The general age-structured mathematical model, with 20 clusters of population at intervals of 5 years from zero age to 100 years is presented in
| [19] | Kemei, Z., T. Rotich, and J. Bitok, Modelling Population Dynamics Using Age-Structured System Of Partial Differential Equations. |
[19]
. Using the same structure, with the social factors considered and incorporated to affect the birth rate, death rate and migration rate, the following equations represent the social factors model.
Let be the age-density function at time t with, where is the maximum age of individuals, or with . Then, we have the number of individuals having ages in the interval at time t given by
(11)
and the total population is given by;
Let be the age- specific birth rate, a function of social factors. The number of births produced by individuals with ages in at any given time t is evaluated as;
Let be the age - specific mortality rate for the cluster, then the total number of deaths at time , occurring over a whole lifespan period , is given by the equation:
with having corresponding differential birth and death rates, together with its associated net migration rate . It is assumed that age dependent fertility rate for immature clusters of ages [0 – 4] and [5 – 9] and also zero for the aged clusters of ages [45 – 99]. Let be the survival rate of individuals transiting from cluster to the next cluster with being the total new born from productive clusters.
The model equations with social factors equivalent to equation (
6) is given for
by;
(15)
With the corresponding initial and boundary conditions given as;
(16)
which accounts for the total births from six actively reproductive clusters, and the twenty initial conditions
describing the initial population of cluster at the start of simulation time .
Equation (
15) can be expressed in compact form as;
(18)
where is the net transition across cluster boundaries.
3. Numerical Solutions of Age-Structured Model with Social Factors
The numerical results of the model in equations (
15-17) is approximated using Crank-Nicolson scheme, an unconditionally stable finite difference scheme
| [20] | Husam Hameed, H., et al. On Newton-Kantorovich method for solving the nonlinear operator equation. in Abstract and Applied Analysis. 2015. Hindawi. |
[20]
. Finite difference scheme is a class of numerical techniques for solving differential equations by approximating derivatives using finite differences
| [21] | Delzanno, G. L., et al., An optimal robust equidistribution method for two-dimensional grid adaptation based on Monge–Kantorovich optimization. Journal of Computational Physics, 2008. 227(23): p. 9841-9864. |
[21]
. Both the spatial and temporal domains are discretized into a finite number of steps, and the value of the solution at these discrete points is approximated by solving algebraic equations containing finite differences and values from nearby points. The use of the Finite Difference numerical method, results in the generation of a set of algebraic equations that can be solved for dependent variables. The set of algebraic equations are solved at the discrete grid points in the physical domain under consideration. The difference relates the values of variables at each grid points to its neighbouring points.
Discretization of equation (
15-17) using Crank-Nicolson scheme yields the equation
(19)
Let and let , then equation (19) reduces to;
Rearranging the elements to have the future time elements on the left and current time on the right yields,
(20)
Equation (
20) forms a set of 22 equations with 20 unknowns representing the population dynamics for cluster
. The extra two equations describe the initial and boundary conditions to be obtained from the information given in the initial and boundary conditions in equation (
16).
In matrix form, equation (
20) can be expressed in compact form as;
Where the coefficient matrices
in equation (
21) are defined as;
while the vectors and
Where the elements in matrix , are defined by , , and , , for the index .
Matrix and matrix are not square matrices, and the two extra columns represent the unknown values and on matrix , together with and on matrix , which are obtained from the boundary and initial conditions.
Following the analysis as provided in
| [19] | Kemei, Z., T. Rotich, and J. Bitok, Modelling Population Dynamics Using Age-Structured System Of Partial Differential Equations. |
[19]
, system (21) is coded and numerically simulated as presented in the next section.
3.1. Model Numerical Simulation
In this section, the numerical model simulation is run and solutions presented by graphical means. The population data used in this model are the Kenyan population census results of 2019. The base year of 2019 is chosen as the initial time , and simulation is run for 31 years to create comparison with actual data for the first 5 years up to 2024, and make predictions of the population in 2050.
Table 1. gives the value of parameters relating to Kenyan demographic report of 2019, together with the following initial data for 20 clusters, of age bracket
. The initial populations of each cluster is denoted by
and are given by;
5,939,306; 5,597,716; 5,034,855; 4,169,543; 3,775,103; 3201226; 2519506; 2008632; 1476169; 1272745; 956206; 711953; 593778; 390763; 339301; 218508; 157900; 95267; 75834 and 54700.
Other parameters used in the model are presented in
Table 1.
Model equation (
21) is numerically simulated as discussed below with the assumption that the ratio of female and male is 1:1, and thus the female population structure only will be subsequently discussed.
Table 1. Model Parameters for Kenyan Population data of 2019.
Item | Symbol | Description | Value |
1 | | Birth rate (assumed constant for all productive clusters) | 0.02639 |
2 | | Infant mortality rate | 0.02786 |
3 | | Net migration rate at the cluster | -0.00019 |
4 | | Transition rate across clusters | 0.65 |
5 | | General mortality rate of the cluster | 0.0313 |
6 | | Variable proportion of social factors provision | [0, 1] |
7 | | Numerical step size | 0.5 |
8 | | Numerical scheme simulation time interval | 1 |
3.2. Model Simulation Results
The discretized model represented by equation (
21) is simulated using data in
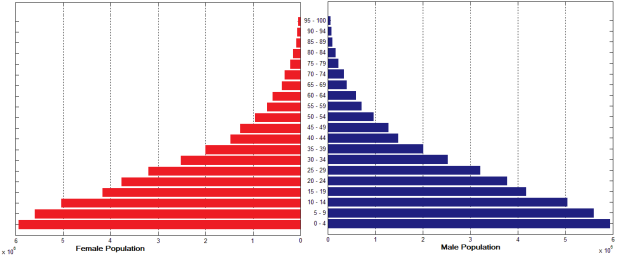
Table 1. The initial population structure of Kenya, as per 2019 population census is depicted in
Figure 4. Notice that the Kenyan population is pyramid like, a characteristic of high birth rate, poor transition rate due to poor health, and high mortality rate. This graph is obtained in absence of social factors; that is
.
In
Figure 4, the population of age
is the largest for both male and female, and narrows down as age advances. The population of the youngest class is
5,939,306 while that of the oldest cluster
is a less than 1% of the young, standing at
54,700.
Note that the dependent population of age bracket are school and college going, together with the age bracket the group that retired from service, add up to 25,848,796 while the working population in the age bracket are 12,740,215. If it is assumed that the middle age are independent and are able to earn a living and support the rest of the population, then the dependency ratio of is obtained, that is, every working person supports two young or old people.
Simulated results as the social factors efficacy is varied, gives an optimal proportion of , at intervals of 5 years as illustrated below.
Figure 4. The Kenya Population Pyramid for 2019 Population Census.
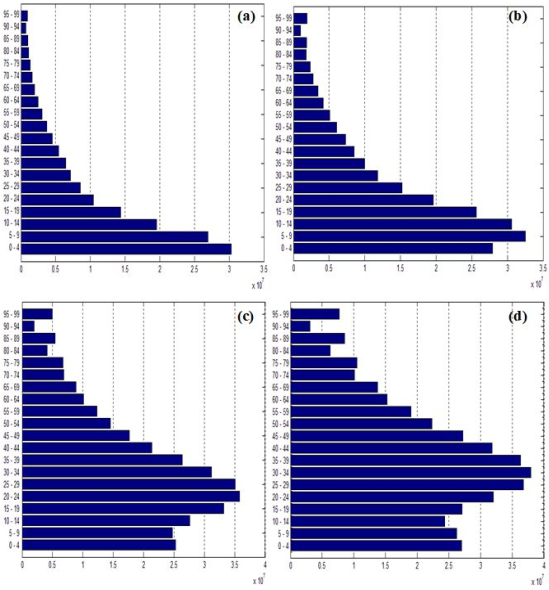
Figure 5. Female population after the first four iterations (generations) with Social factors. The population indicated are (a) after 5 years, (b) after 10 years, (c) after 20 years and (d) after 25 years.
Further simulation after 31 years, the population pyramid is presented in
Figure 6 for both male and female gender.
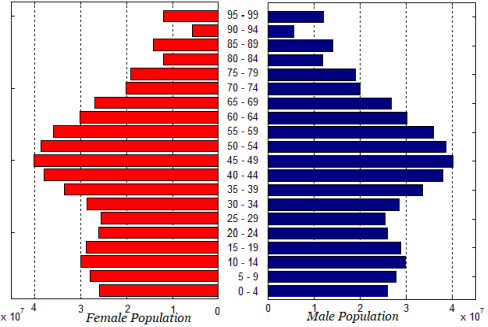
Figure 6. Kenyan 2050 Population pyramid simulated for a period of 31years from 2019.
Simulated results of 2050 clearly indicates the change in population to a constrictive structure pyramid characterized by positive increase literacy levels, increased access to quality health, low mortality, low fertility, and improved living standards. In this model, population has increased from 38,589,011 to 57,956,100, a 50% increase. Using the same criterion, the dependency ratio will have dropped to 1:1.13665.
4. Conclusion and Recommendation
The findings of this research study include modification or extension of Von-Foester and McKendrick
| [10] | Şterbeţi, C. On a model for population with age structure. in ITM Web of Conferences. 2020. EDP Sciences. |
[10]
equation, to capture distinct population growth parameetrs of different age brackets. This led to the structuring of human lifespan
into 20 clusters at intervals of 5 years from
, with a transition rate between clusters included. This gave rise to 20 partial differential equations, with corresponding initial and boundary conditions. Simulation of the effect of social factors was done was done using Crank-Nicolson numerial scheme with data from Kenyan demographic parameters of 2019. It was found that, optimal provision of social factors at
to a herd population of 70% yields a stable birth and death rates of
and
respectively, which leads to a stable population of approximately 58million after 35 years, up from approximately 28million in 2019. Consequently, economic dependency ratio is improved from 1:2 to almost 1:1. It is concluded that social factors have a significant impact on birth rates, mortality rate, net migration rate and collectively on the population growth, and besides other population control strategies, industrialization, economic development and improvement of social factors like health standards, roads, housing, food security among others whould not be ignored. This therefor calls for proper planning with the ultimate stable population in mind.
It is recommeded that this study is extended to include both age and sex structured dynamics and distict parameters for male and female to be captured, putting into consideration the effect contemporary (LGBTQ) lesbian, gay, bisexual, transgender and queer association reproductive dynamics. It is also recommended that cost component of provision of social factors to be incorporated and optimized to detrmine the minimum and cost effective herd population.
Abbreviations
AIDS | Acquired Immune Deficiency Syndrome |
B | Number of Births with B(t) as Number of Births at Time t |
D | Number of Deaths with D(t) as Number of Deaths at Time t |
E | Number of Emigrants with E(t) as the Number of Emigrants at Time t |
HIV | Human Immunodeficiency Virus |
I | Number of Immigrants with I(t) as the Number of Immigrants at Time t |
K | Initial Population with Denoting Initial Population of Cluster |
M | Net Migration with M(t) as the Net Migration |
P | Total Population with P(t) as Population at Time t, and P(t+1) as Population at Time (t+1) |
Author Contributions
Zachary Kemei: Formal Analysis, Methodology, Writing – original draft, Writing – review & editing
Jacob Bitok: Conceptualization, Formal Analysis, Supervision, Validation
Titus Rotich: Software, simulation and Supervision
Conflicts of Interest
The authors declare no conflicts of interest.
References
| [1] |
Hugo, G., Future demographic change and its interactions with migration and climate change. Global Environmental Change, 2011. 21: p. S21-S33.
|
| [2] |
Brauer, F., C. Castillo-Chavez, and C. Castillo-Chavez, Mathematical models in population biology and epidemiology. Vol. 2. 2012: Springer.
|
| [3] |
Ehrlich, P. R., A. H. Ehrlich, and G. C. Daily, Food security, population and environment. Population and development review, 1993: p. 1-32.
|
| [4] |
Uniyal, S., et al., Human overpopulation: Impact on environment, in Megacities and Rapid Urbanization: Breakthroughs in Research and Practice. 2020, IGI Global. p. 20-30.
|
| [5] |
Smith, D. W., et al., Population dynamics and demography. Yellowstone wolves: science and discovery in the world's first national park, 2020: p. 77-92.
|
| [6] |
Bender, E. A., An introduction to mathematical modeling. 2000: Courier Corporation.
|
| [7] |
Wilensky, U. and W. Rand, An introduction to agent-based modeling: modeling natural, social, and engineered complex systems with NetLogo. 2015: Mit Press.
|
| [8] |
White, G. C., Modeling population dynamics. Ecology and management of large mammals in North America, 2000: p. 85-107.
|
| [9] |
DILÃO, R., Mathematical models in population dynamics and ecology, in Biomathematics: modelling and simulation. 2006, World Scientific. p. 399-449.
|
| [10] |
Şterbeţi, C. On a model for population with age structure. in ITM Web of Conferences. 2020. EDP Sciences.
|
| [11] |
Di Cola, G., G. Gilioli, and J. Baumgärtner, Mathematical models for age-structured population dynamics: an overview. Population and Community Ecology for Insect Management and Conservation, 2020: p. 45-62.
|
| [12] |
Ehrlich, P. R., Environmental disruption: Implications for the social sciences. Social Science Quarterly, 1981. 62(1): p. 7.
|
| [13] |
Strikwerda, J. C., Finite difference schemes and partial differential equations. 2004: SIAM.
|
| [14] |
Lutz, W. and R. Qiang, Determinants of human population growth. Philosophical Transactions of the Royal Society of London. Series B: Biological Sciences, 2002. 357(1425): p. 1197-1210.
|
| [15] |
Headey, D. D. and A. Hodge, The effect of population growth on economic growth: A meta‐regression analysis of the macroeconomic literature. Population and development review, 2009. 35(2): p. 221-248.
|
| [16] |
De Meijer, C., et al., The effect of population aging on health expenditure growth: a critical review. European journal of ageing, 2013. 10: p. 353-361.
|
| [17] |
Odhiambo, V. A., Critical success factors in the implementation of the social pillar of Kenyans vision 2030. 2014, University of Nairobi.
|
| [18] |
González-Olivares, E., P. C. Tintinago-Ruiz, and A. Rojas-Palma, A Leslie–Gower-type predator–prey model with sigmoid functional response. International Journal of Computer Mathematics, 2015. 92(9): p. 1895-1909.
|
| [19] |
Kemei, Z., T. Rotich, and J. Bitok, Modelling Population Dynamics Using Age-Structured System Of Partial Differential Equations.
|
| [20] |
Husam Hameed, H., et al. On Newton-Kantorovich method for solving the nonlinear operator equation. in Abstract and Applied Analysis. 2015. Hindawi.
|
| [21] |
Delzanno, G. L., et al., An optimal robust equidistribution method for two-dimensional grid adaptation based on Monge–Kantorovich optimization. Journal of Computational Physics, 2008. 227(23): p. 9841-9864.
|
Cite This Article
-
ACS Style
Kemei, Z.; Bitok, J.; Rotich, T. Modeling the Effects of Social Factors on Population Dynamics Using Age-Structured System. Am. J. Appl. Math. 2024, 12(6), 236-245. doi: 10.11648/j.ajam.20241206.13
 Copy
|
Copy
|
 Download
-
@article{10.11648/j.ajam.20241206.13,
  author = {Zachary Kemei and Jacob Bitok and Titus Rotich},
  title = {Modeling the Effects of Social Factors on Population Dynamics Using Age-Structured System
},
  journal = {American Journal of Applied Mathematics},
  volume = {12},
  number = {6},
  pages = {236-245},
  doi = {10.11648/j.ajam.20241206.13},
  url = {https://doi.org/10.11648/j.ajam.20241206.13},
  eprint = {https://article.sciencepublishinggroup.com/pdf/10.11648.j.ajam.20241206.13},
  abstract = {The study of demographics is important not only for policy formulation but also for better understanding of human socio-economic characteristics, and assessment of effects of human activities on environmental impact. It is interesting to note that apart from the common population control strategies, industrialization, economic development and improvement of living standards affects population growth parameters. In this paper, an age-structured model was formulated to model population dynamics, and make predictions through simulation using 2019 Kenya population data. The age-structured mathematical model was developed, using partial differential equations on population densities as functions of age and time. The population was structured into 20 clusters each of 5 year interval, and assigned different birth, death rate and transition parameters. Crank-Nicolson numerical scheme was used to simulate the model using the 2019 parameters and population as initial conditions. It was found that; provision of social factors to an efficacy level of δ≥0.75 to a minimum of 70% population leads to a decrease of mortality rate form μold=0.0313 to μnew=0.00184 and an increase in birth rate from βold=0.02639 to βnew=0.05104. This collectively leads to an increase in population by 50% from 38,589,011 to 57,956,100 after 35 years. The initial economic dependency ratio of 1:2, was also improved due to changes in technology and improvement of living standards, to a new ratio of 1:1.14. The graphical presentation in form of a pyramid showed a trend of transition from expansive to constrictive population pyramid. This population structure is stable and remains relatively constant as long as the social factors are maintained.
},
 year = {2024}
}
Copy
|
Download
-
TY  - JOUR
T1  - Modeling the Effects of Social Factors on Population Dynamics Using Age-Structured System

AU  - Zachary Kemei
AU  - Jacob Bitok
AU  - Titus Rotich
Y1  - 2024/11/28
PY  - 2024
N1  - https://doi.org/10.11648/j.ajam.20241206.13
DO  - 10.11648/j.ajam.20241206.13
T2  - American Journal of Applied Mathematics
JF  - American Journal of Applied Mathematics
JO  - American Journal of Applied Mathematics
SP  - 236
EP  - 245
PB  - Science Publishing Group
SN  - 2330-006X
UR  - https://doi.org/10.11648/j.ajam.20241206.13
AB  - The study of demographics is important not only for policy formulation but also for better understanding of human socio-economic characteristics, and assessment of effects of human activities on environmental impact. It is interesting to note that apart from the common population control strategies, industrialization, economic development and improvement of living standards affects population growth parameters. In this paper, an age-structured model was formulated to model population dynamics, and make predictions through simulation using 2019 Kenya population data. The age-structured mathematical model was developed, using partial differential equations on population densities as functions of age and time. The population was structured into 20 clusters each of 5 year interval, and assigned different birth, death rate and transition parameters. Crank-Nicolson numerical scheme was used to simulate the model using the 2019 parameters and population as initial conditions. It was found that; provision of social factors to an efficacy level of δ≥0.75 to a minimum of 70% population leads to a decrease of mortality rate form μold=0.0313 to μnew=0.00184 and an increase in birth rate from βold=0.02639 to βnew=0.05104. This collectively leads to an increase in population by 50% from 38,589,011 to 57,956,100 after 35 years. The initial economic dependency ratio of 1:2, was also improved due to changes in technology and improvement of living standards, to a new ratio of 1:1.14. The graphical presentation in form of a pyramid showed a trend of transition from expansive to constrictive population pyramid. This population structure is stable and remains relatively constant as long as the social factors are maintained.

VL  - 12
IS  - 6
ER  -
Copy
|
Download